Discover Symphonies
In Composer’s Discover section, you can explore our growing collection of ready-made strategies (which we call symphonies). First, click on "Discover" in the top-right corner navigation bar when you log in. From there, you'll have the option to search for symphonies based on the name of or the tickers you are looking for.

The Discover page is powered by Composer's AI that understands, builds, and executes trading strategies end-to-end. Instead of scrolling through thousands of symphonies manually, you have a few ways to find what fits you:
- Browse top performers. The AI surfaces high-performing symphonies from Composer's collection and explains how each one works: what logic it follows, what assets it trades, and why it might be worth considering.
- Share your preferences. Tell the AI what you're interested in (tech stocks, ETFs, crypto, momentum strategies) and it will surface symphonies that match your approach. No search filters required.
- Build your own. Not sure where to start? Answer a few questions and the AI will help you create a symphony based on common patterns from community-built strategies.
Every AI-surfaced or AI-created symphony comes with clear logic, backtests, and risk stats. You review and confirm before anything runs.
Let's check out the Believe in Big Tech symphony as an example. The symphony fact sheet shows how a symphony works and includes a backtest. Backtests are a model of how the symphony would have performed in the past using historical data.

The Believe in Big Tech symphony is made up of 8 popular tech stocks. Every month, this symphony holds the top two stocks based on the last 20 day cumulative return.

This symphony uses a momentum strategy. It picks winners -- the assets that have been performing the best over the past 3 months -- and sells losers -- the assets that are no longer performing well.
In the backtest, you can see the symphony’s hypothetical performance modelled using historical data over the entire span of time the assets making up the symphony have existed. The Add Benchmarks button at the bottom allow you to add other stocks and ETFs as comparison points.

You can see metrics on the symphony’s performance over this period, like the annualized return -- how much the investment would’ve made on average per year, assuming the return was compounded -- and the Sharpe ratio -- a measure of risk-adjusted return.

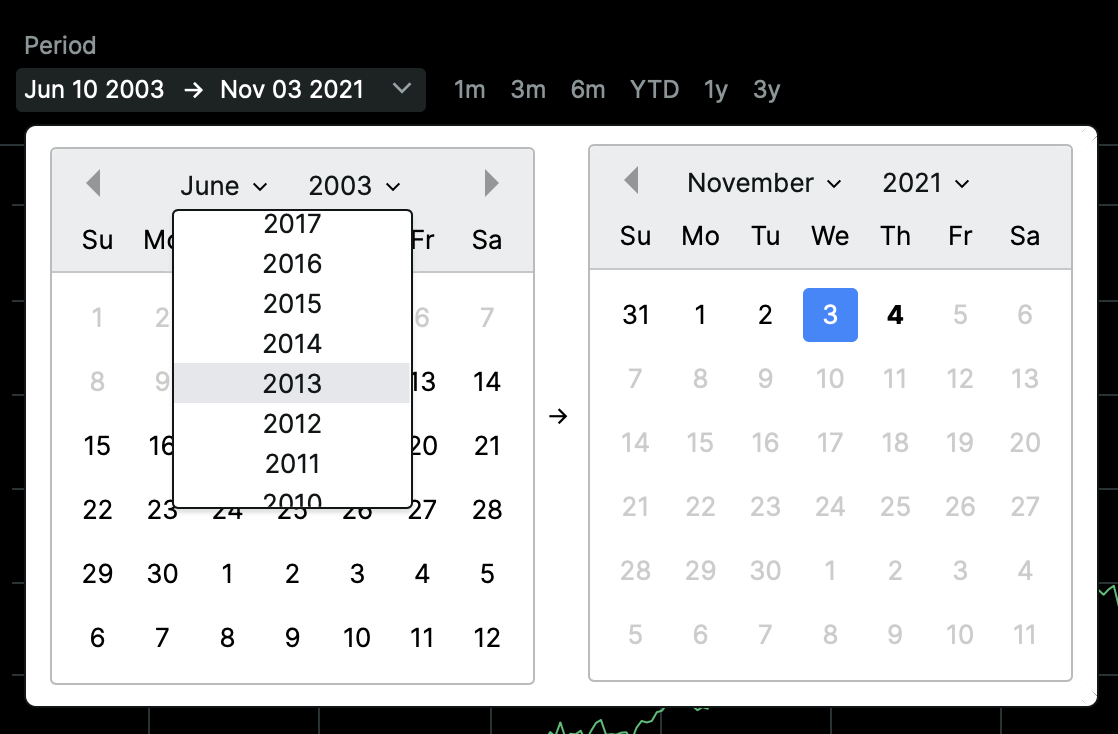
You can change the time period of the backtest by using the date selector or time period presets at the top of the graph.
If you’d like to see more performance metrics for the symphony and the benchmark, you can scroll down to the Detailed Performance Metrics section.

Once you’ve checked out the symphony, and if you decide you’re interested in it, you have a few possible next steps.
1) Watch performance: If you’d like to watch the symphony to see how it performs in real time, click Watch and the symphony will be added to your Watch list. This gives the symphony a simulated $1000 (just like paper trading) to let you monitor the symphony over time.
2) Invest: If you’re ready to put money toward this symphony, click “Invest”.

3) Make edits: If the symphony inspires you but you’d like to make some changes to it, click Edit. This takes you the symphony no-code visual editor. You can find a youtube tutorial on Editing a Symphony here. If you make changes to a symphony that you copied into your account, those changes will remain private only in your account.